Using Pain Diagrams to Understand Lumbar Spinal Stenosis
Degenerative lumbar spinal stenosis (LSS) is one of the most common and disabling spinal conditions seen in secondary care, affecting roughly one in three patients referred to specialist spine services. Its hallmark is lower extremity pain, yet the distribution of pain is often highly variable, making diagnosis and treatment planning a challenge.
The “textbook” descriptions—central canal stenosis causing bilateral buttock, thigh, or calf pain (neurogenic claudication) versus lateral recess/foraminal stenosis causing unilateral radicular pain—are oversimplified. In reality, many patients have mixed stenosis and subjective pain reporting that does not fit cleanly into either category.
This variability can complicate:
- Clinical reasoning
- Differentiation from other conditions (e.g., hip OA, vascular claudication)
- Research on targeted treatments
One potential solution? Patient-completed pain diagrams (PDs).
Pain Diagrams: A Visual and Quantifiable Tool
Pain diagrams are simple drawings completed by patients to indicate where they feel pain. In LSS, they can:
- Capture location and distribution of pain
- Reflect the patient’s subjective pain experience
- Identify patterns that may be linked to underlying pathology
With modern digital tools, PDs can be quantified and compared across patients, allowing therapists to see recurring pain patterns and potentially classify patients into subgroups.
Key Study Insights
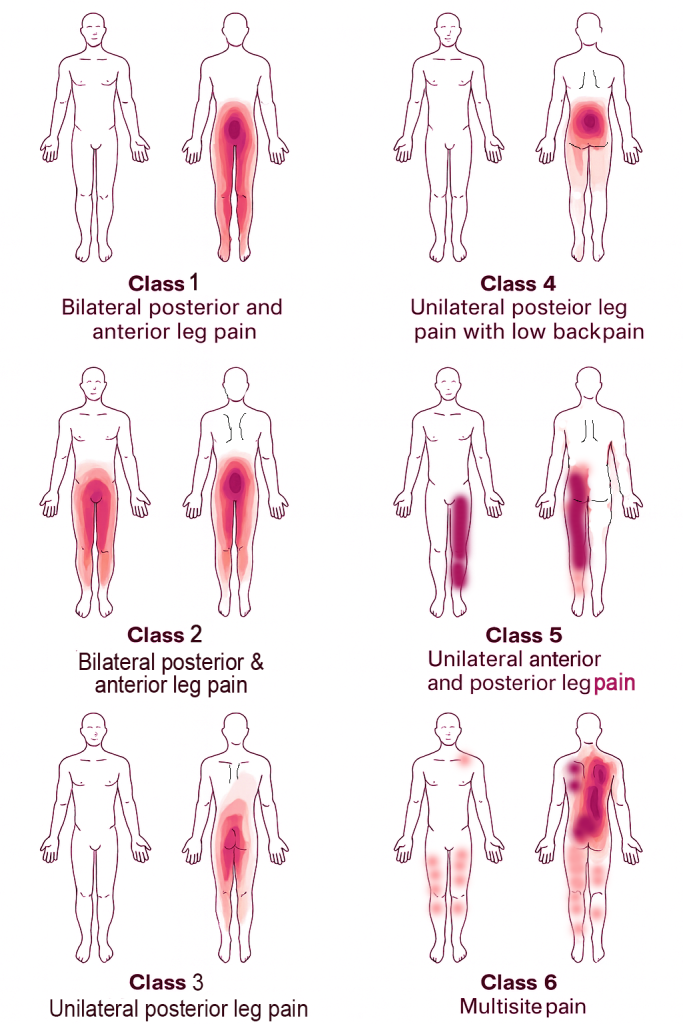
A recent large-scale analysis from Denmark examined digital PDs from 2,379 LSS patients and identified six distinct pain distribution patterns using latent class analysis:
- Bilateral posterior leg pain – 11.4%
- Bilateral posterior + anterior leg pain – 8.7%
- Unilateral posterior leg pain – 26.1%
- Unilateral posterior leg pain + low back pain – 21.0%
- Unilateral anterior + posterior leg pain – 22.9%
- Multisite pain – 9.9%
🔹 Key clinical takeaway: Pain in LSS is more heterogeneous than classic teaching suggests. Notably, unilateral anterior + posterior leg pain was more common than bilateral leg patterns.
Implications for Therapy
1. Better Differential Diagnosis
Therapists can use PDs to differentiate LSS from conditions like hip OA, peripheral neuropathy, or multi-joint pain syndromes.
Example: A multisite pain diagram may prompt consideration of systemic pain drivers rather than a single-level decompression.
2. More Individualized Treatment Planning
- Central-type patterns may respond well to flexion-based exercises and endurance walking programs.
- Lateral-type patterns may benefit from nerve mobility work, targeted loading, and specific posture modifications.
3. Enhanced Patient Communication
A visual PD can help patients understand:
- Why their pain does not fit a “standard” picture
- The rationale for a specific treatment approach
- How multiple pain sources may contribute to symptoms
- 4. Research and Prognosis
- PDs could help identify LSS phenotypes linked to surgical versus conservative outcomes, guiding more personalized care.
Limitations to Consider
- Diagnostic codes may misclassify some patients
- Imaging correlation was not part of this study
- Pain diagrams captured location, not character (e.g., burning, numbness)
- Findings may represent more severe LSS cases due to the secondary care setting
Practical Tips for Therapists
- Incorporate digital or paper PDs into initial assessments for suspected LSS
- Compare the patient’s pattern with known LSS distributions
- Use PDs at follow-up visits to monitor pain migration or resolution
- Discuss patterns openly with patients to set realistic expectations
Bottom Line
LSS pain patterns are far more variable than the bilateral/unilateral “textbook” model. Digital pain diagrams offer a low-cost, high-yield method for capturing and understanding this complexity.
By integrating PDs into your assessment, you can improve diagnostic clarity, refine treatment plans, and enhance patient engagement—all while contributing to a growing evidence base on LSS pain phenotyping.
Massage Therapy and Body Image